



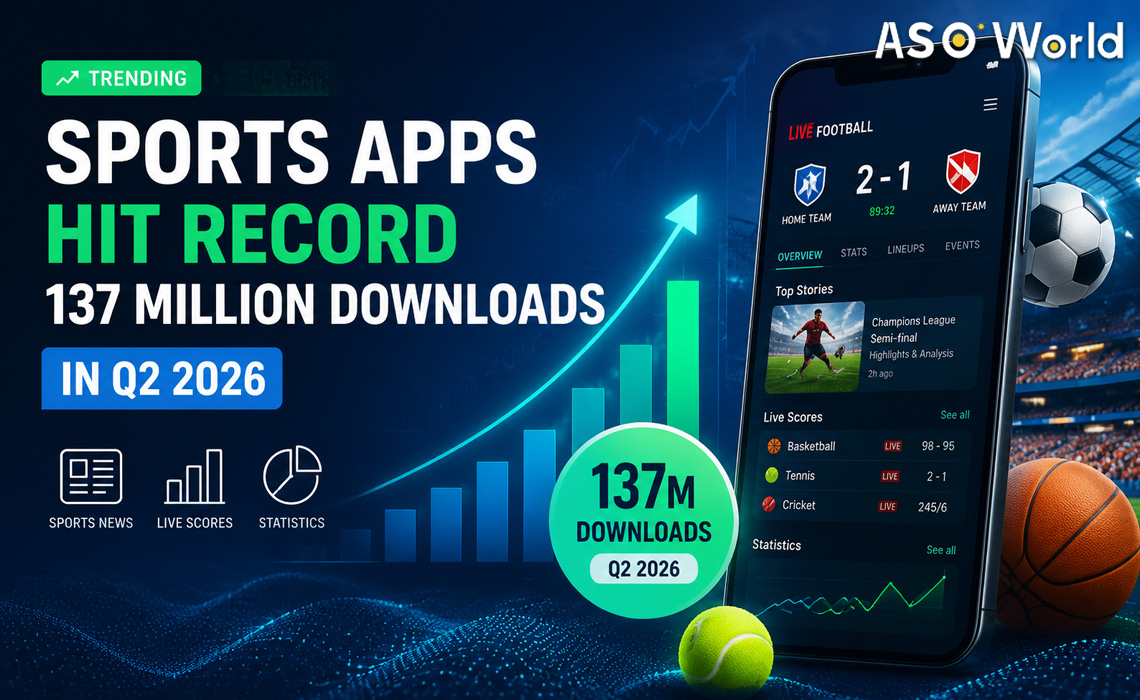

Sports news, statistics and live-scores apps just closed their strongest quarter on record — and the numbers reveal far more than a fan-engagement story. For app developers and mobile marketers, Q2 2026 is a case study in how a "utility + content" vertical is quietly rewriting the playbook on retention, monetization mix, and paid UA economics.
Sports Apps Just Booked a Record Quarter — Here's the Marketer's Read
According to newly released Sensor Tower data (July 2026), sports news, statistics and live-scores apps hit 137 million downloads globally in Q2 2026 — an all-time quarterly peak for the category. Across the wider sports-content ecosystem (apps + mobile web), the same period generated 1.2 billion new installs, $1.4 billion in in-app purchase revenue, 2.3 billion hours of time spent, 81 billion web visits, and $3.3 billion in digital ad spend.
Most coverage will stop at the headline number. We won't. Below is what these figures actually tell an app publisher, a growth marketer, and an ASO team planning H2 roadmaps.
Q2 2026 at a Glance
|
Metric (Q2 2026, Sports Content) |
Value |
|
Live-scores & stats app downloads |
137M (record) |
|
Total category downloads (app + web) |
1.2B |
|
In-app purchase revenue |
$1.4B |
|
Aggregate time spent |
2.3B hours |
|
Web visits |
81B |
|
Digital ad spend against the vertical |
$3.3B |
Source: Sensor Tower, July 2026
Why Q2? Three Structural Drivers Marketers Should Not Miss
A record quarter rarely happens by accident. Three overlapping forces pushed sports apps into a new demand tier:
- A stacked event calendar. The April–June window overlapped playoff runs across major North American leagues, European football finals, and the early qualifiers of the 2026 FIFA World Cup — a natural install spike that publishers with mature UA funnels captured disproportionately.
- Second-screen behavior is now default. 2.3 billion in-app hours in a single quarter confirms what CTV analysts have argued for two years: the phone is no longer the companion screen, it's the stats layer on top of the broadcast. Session length, not install count, is where the real leverage lives.
- Regulated betting adjacency. In markets where sportsbooks now sit inside or beside live-scores flows, IAP and ad ARPDAU compound. That is how a category can pull $1.4B in IAP while remaining nominally "free content."
The Unit Economics Nobody Is Talking About
Divide the numbers and the picture sharpens. On a rough back-of-envelope basis, the category is generating roughly $1.17 in IAP per download in Q2 alone — before ad monetization. Layer in ~17 hours of time-spent per download-equivalent, and sports apps look less like a news vertical and more like a mid-core gaming vertical with a content wrapper.
That reframing matters because it changes the benchmark:
- Retention curves should be measured against gaming D7/D30, not against news apps.
- Creative testing cadence needs to match event cycles (matchday, transfer window, playoff bracket) — not calendar quarters.
- Store listing conversion becomes the single biggest lever, because paid UA CPMs against sports audiences are being bid up by a $3.3B ad-spend pool.
ASO & Store Listing: Where the Q3 Advantage Will Be Won
With paid channels getting more expensive by the week, organic discovery is where challenger apps can still out-run incumbents. Three patterns are separating winners from the pack:
- Event-indexed keyword rotation. Top-ranking live-scores apps are refreshing subtitle and short-description terms around named tournaments and star athletes on a two-week cycle. Static metadata is a losing strategy in a category this seasonal.
- Screenshot storytelling over feature lists. The best-converting listings lead with a moment — a goal alert, a stat overlay, a lineup card — not a feature grid. Emotion > taxonomy.
- Localized cultural relevance. Cricket in South Asia, football in LATAM and MENA, basketball in Southeast Asia — publishers running a single global creative are leaving 30–50% conversion on the table versus market-tailored variants.

Monetization Mix Is Shifting: Ads Are No Longer the Default
Historically, sports-content apps ran on 80%+ ad revenue. The Q2 numbers hint at a rebalance. With IAP at $1.4B against $3.3B of digital ad spend flowing into the category, the emerging model looks like a three-layer stack:
- Layer 1 — Free ad-supported feed: scores, standings, headlines. Broadest reach, lowest ARPU.
- Layer 2 — Subscription tier: ad-lite, advanced stats, fantasy tools, personalized alerts.
- Layer 3 — Transactional adjacency: ticketing, merch, regulated betting hand-offs, creator tipping.
Publishers still monetizing only Layer 1 in Q3 2026 are effectively subsidizing competitors who monetize all three.
The Risks Hiding Inside a Record Quarter
- Post-tournament cliff. Categories that peak during events also trough after them. Retention design (push cadence, off-season content, cross-league recommendations) is what turns a spike into a base.
- Rights fragmentation. The same match may be locked behind three different streamers in three different markets. Apps that lean too hard on a single league's data feed inherit that concentration risk.
- Ad-spend inflation. $3.3B of quarterly ad spend chasing the same audience means CPIs are climbing. Organic and referral loops are no longer "nice to have."
Five Takeaways for App Marketers Planning H2 2026
- Benchmark retention against gaming, not news — the engagement profile has changed.
- Move to a two-week ASO refresh cycle tied to the sporting calendar.
- Build market-specific creative variants; global-one-size listings are underperforming by double-digit percentages.
- Stress-test the Layer 2 subscription before the post-tournament cliff hits.
- Treat Q2's $3.3B ad-spend pool as a warning: your paid CAC is going up, so double the investment in organic and referral.
The Bottom Line
137 million downloads is the headline. The story is that sports apps have quietly graduated from a content vertical into a full-stack consumer category — with gaming-grade engagement, three-layer monetization, and an ad market bidding it up in real time. For developers and marketers who read the signal correctly, the second half of 2026 is not about riding the wave. It's about owning the retention curve after the whistle blows.

 Follow Us on Facebook
